YTelemetry
Telemetry
There are a few ways of developing your code on Raspberry Pis for PiWars: - write your code on Raspberry Pi using monitor and keyboard attached to the RPi - write your code on Raspberry Pi using ssh - write your code on Raspberry Pi using X11 tunnelled back to your computer/laptop's X11 Terminal (client program) - write Python on your laptop/computer, copy it to Raspberry Pi (scp/samba/...), ssh back to RPi to run it - use sophisticated IDEs like Pro version of PyCharm that know how to execute Python code remotely piping shell output back to IDE's console - use PyROS
I've enumerated options from simplest to most complex and from least convenient (it is quite hard chasing your rover with monitor and keyboard in your hands while attached to it) to most convenient. Having IDE doing heavy lifting for you (Pro version of PyCharm) is very useful but it costs money (£70 a year for individuals). Using PyROS is almost as easy as IDE - at least can be made easy.
$ pyros myrover upload -s -r -f wheels wheels-controller.py
This would be an example how to upload new version of 'service' wheels (python file wheels-controller.py) and keep the 'connection' on (-f option) - pumping 'logs' (stdout) back. If at any point you stop it you can continue monitoring stdout from a service by:
$ pyros myrover log wheels
But, all those predicate you use print statements in Python to log what is going on with you code. In case (as it is ours) we have a few loops running at significant speeds (over 200Hz) gathering data (from AS5600 for wheel orientation, accelerometer, gyroscope and compass from IMU and such). Just imagine the amount of text printed out all the time to stdout. Also, as PyROS utilises MQTT for communication between processes (and shell commands as above) it would make output really big and 'clog' network throughput. Additional problem is that not all output is coming from the same PyROS 'service' (an unix process maintained by PyROS) - so you would need to simultaneously monitor several process logs.
Requirements
One option would be to write to log files. But, then, how far you can go with writing to SD card? It has limited throughput as well. Then you would create several files, which would need to be downloaded after the run and analysed in parallel. Not an easy job. All of this lead us to decide to create simple data gathering system - a simple telemetry library!
Ideas were like following: - ability to define the structure of data - ability to 'pump' larger amounts of structured data to the logging system - ability to fetch data on demand from client/analysing software - nice to have: ability to produce aggregate of gathered data for real time telemetry
So, here it is - small side project of Games Creators Club: GCC-Telemetry
Design
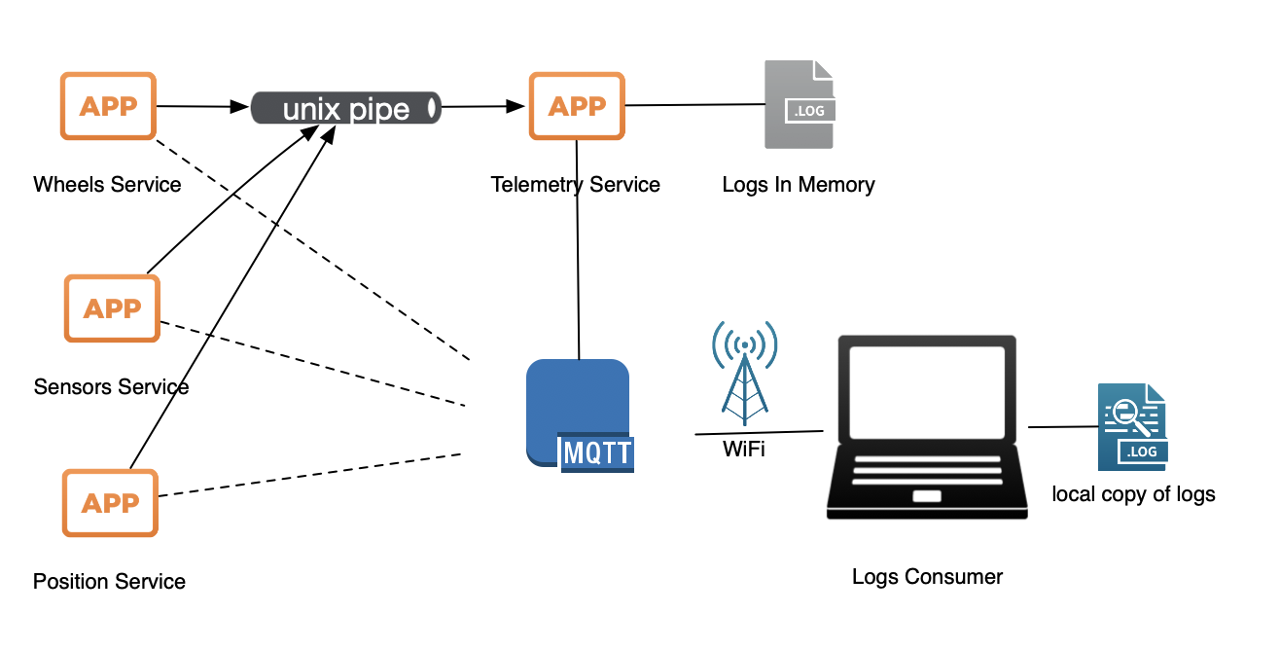
This is high level overview how GCC-Telemetry works: each process has two 'channels' of communication to central 'telemetry' service. One is 'general', low bandwidth used for setting up a 'stream' of data (stream of records of same type) and one is as fast as we can devise - an unix pipe to log data. Second channel is supposed to be as quick and unobtrusive to the system as possible. It would be unfair for rest of the system to suffer from a few services dumping larger amounts of data to the centra place (telemetry service). Unix pipes seem to be one of the fastest means of interprocess communication - especially if shared memory is not easy option due to several processes needed same service. Local sockets seem to be ever so slightly slower and still are kept as a 'Plan-B', a fallback solution in case it is needed. Also, sockets would work across more Raspberry Pis, too.
The telemetry service, then collects all the log records thrown at it and stores them in the memory. Since most of the PiWars challenges last around 10min max (600 seconds) and if we extrapolate amount of data to example of 200Hz feed or 20-ish float point numbers (double precision - 8 bytes long) each record would be 160bytes x 200 times a second x 600 seconds ~= 18MB - amount of memory we can sacrifice for logging. PiZero is quite tight with memory but 50-100MB (in the worst possible case) is something that can be put aside for logging if really needed. The downside of keeping it all in memory is losing data in case of a process dying or PiZero browns out before data is extracted. There's still option of storing that data slowly (for example at half the SD I/O throughput) to SD card, but it is not implemented. Yet.
The last piece of the puzzle is a client that can request data when convenient (and won't affect finely tuned software and sensor processing) - at the end of the run or trickling data through the run. Client would use MQTT (as rest of the PyROS architecture) and fetch each stream of data to local memory and do something with it.
Stream
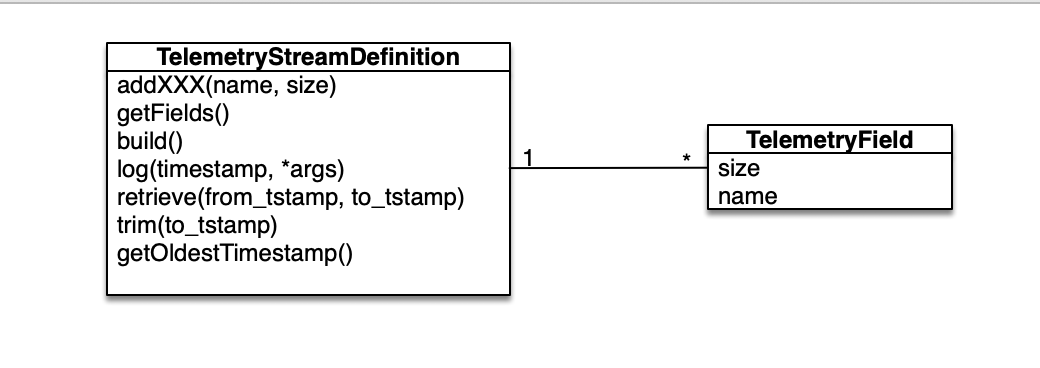
Stream is defining something like fixed size record of byte fields. Using TelemetryStreamDefinition class you can define your stream by giving it a name in constructor and then define fields by calling addXXX methods (addByte, addDouble, ...). Available types (and methods) are:
addByte(self, name, signed=False)addWord(self, name, signed=False)addInt(self, name, signed=True)addLong(self, name, signed=True)addFloat(self, name)addDouble(self, name)addTimestamp(self, name)addFixedString(self, name, size)addFixedBytes(self, name, size)addVarLenString(self, name, size)addVarLenBytes(self, name, size)
Unfortunately variable length strings and variable byte arrays are not yet implemented.
Logger
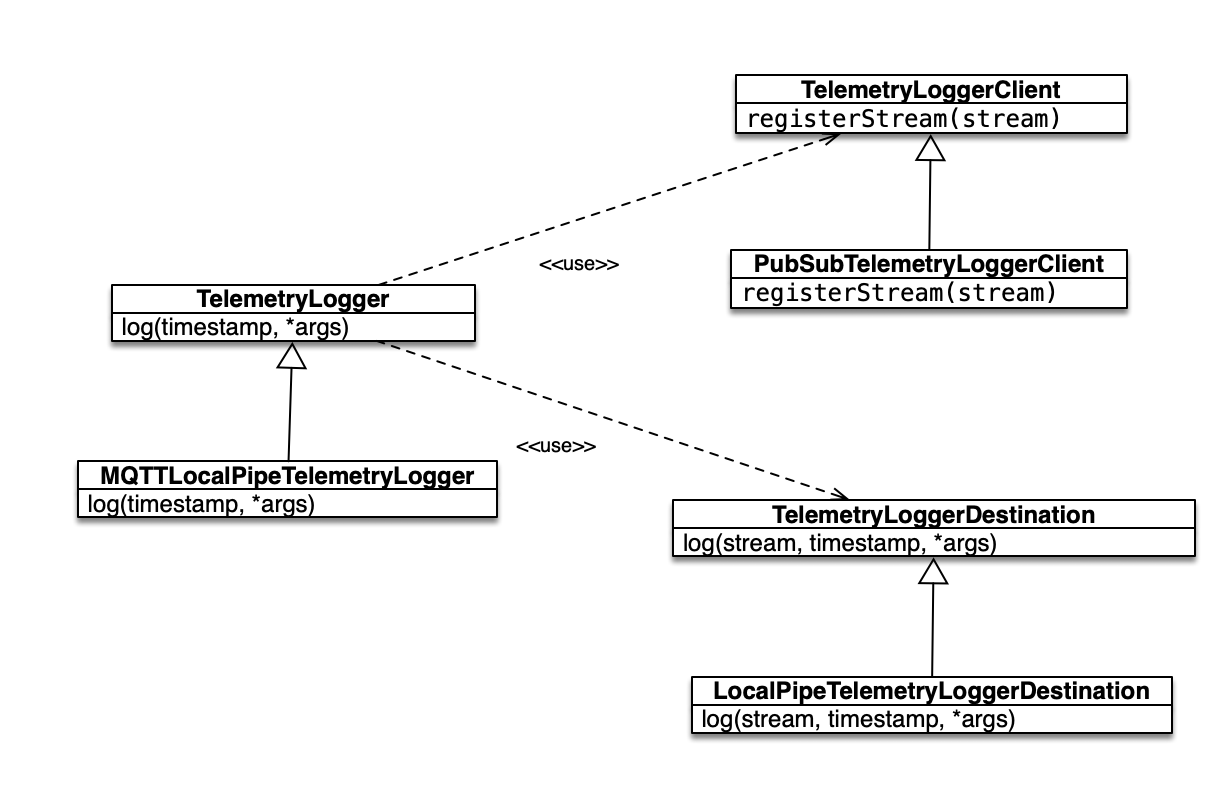
Stream on its own is just an definition. In order for that definition to be put in use we've extended the class to get StreamLogger. Stream logger is main entry point for processes that need to store telemetry data to the system. Also, we can use logger to define stream. For instance:
For example:
        steer_logger = telemetry.MQTTLocalPipeTelemetryLogger('wheel-steer')
        steer_logger.addFixedString('wheel', 2)
        steer_logger.addFixedString('action', 2)
        steer_logger.addDouble('current')
        steer_logger.addByte('status')
        steer_logger.addDouble('speed')
        steer_logger.addDouble('pid_last_output')
        steer_logger.addDouble('pid_last_delta')
        steer_logger.addDouble('pid_set_point')
        steer_logger.addDouble('pid_i')
        steer_logger.addDouble('pid_d')
        steer_logger.addDouble('pid_last_error')
        steer_logger.init()
Telemetry server is going to reject new stream created with different definition for exactly the same stream name. You can defined exactly the same stream on two different places and send interleaving logs in.
When stream was successfully created we can then use it to log our data in through log method. For instance:
steer_logger.log(time.time(), bytes(wheelName, 'ascii'), STOP_OVERHEAT, curDeg, status | STATUS_ERROR_MOTOR_OVERHEAT, speed, pid.last_output, pid.last_delta, pid.set_point, pid.i, pid.d, pid.last_error)
Server and Storage
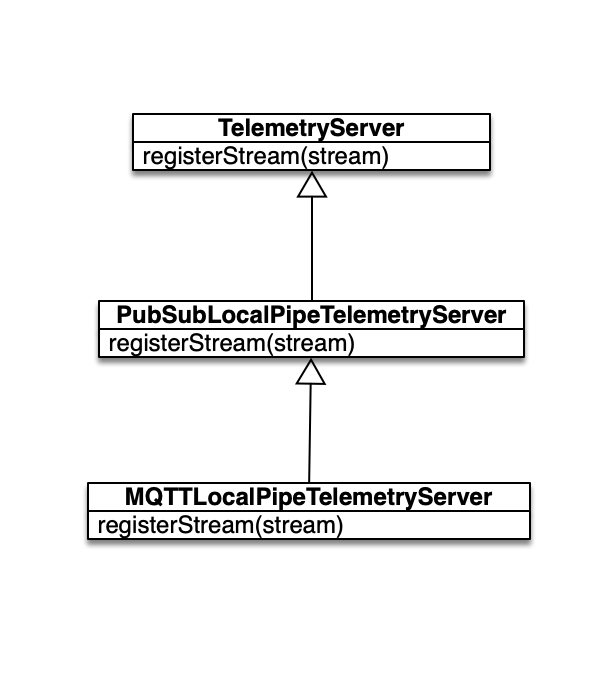
Telemetry server needs to be started as an service (a process for instance or a separate thread) to collect and keep data.
server = MQTTLocalPipeTelemetryServer()
That will subscribe to appropriate MQTT topics (you can change prefix but default is 'telemetry/') and start listening to requests. Also, server needs two more details: where data is stored (TelemetryStorage) and how data is collected. For instance PubSubLocalPipeTelemetryServer constructor has following defaults:
def __init__(self, topic='telemetry', pub_method=None, sub_method=None, telemetry_fifo="~/telemetry-fifo", stream_storage=MemoryTelemetryStorage()):
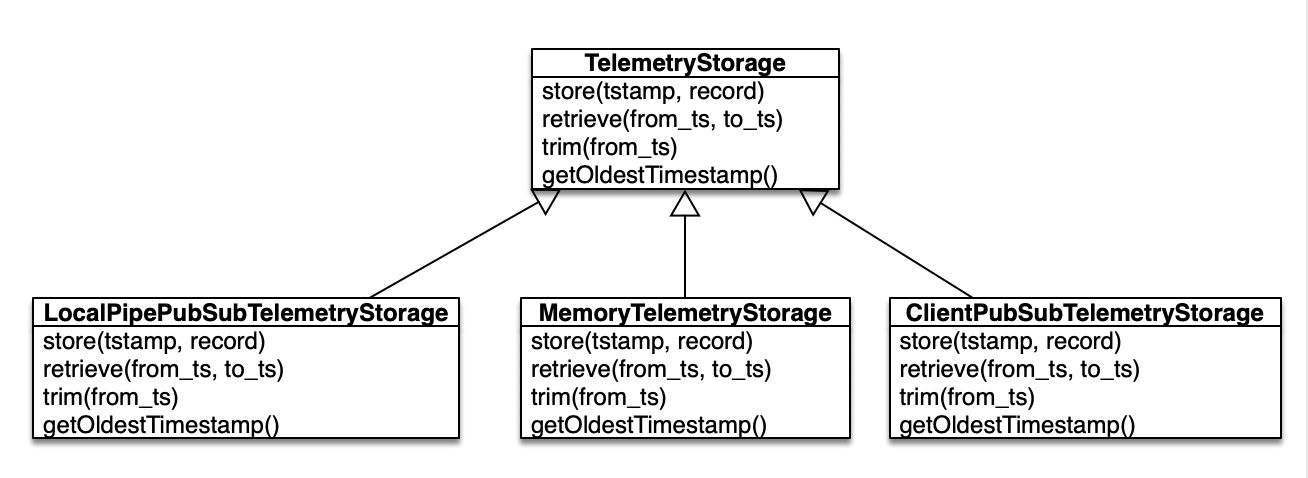
There are three kinds of extensions for storage:
- MemoryTelemetryStorage - it stores all data to local array (you can limit number of records, by default it is limited to 100000)
- LocalPipePubSubTelemetryStorage - was to be used with TelemetryLogger but it was implemented in a simpler way
- ClientPubSubTelemetryStorage - clients that want to add to log storage remotely (not used)
Client
Last component is client TelemetryClient class which is to be used on laptop/computer to retrieve logs.
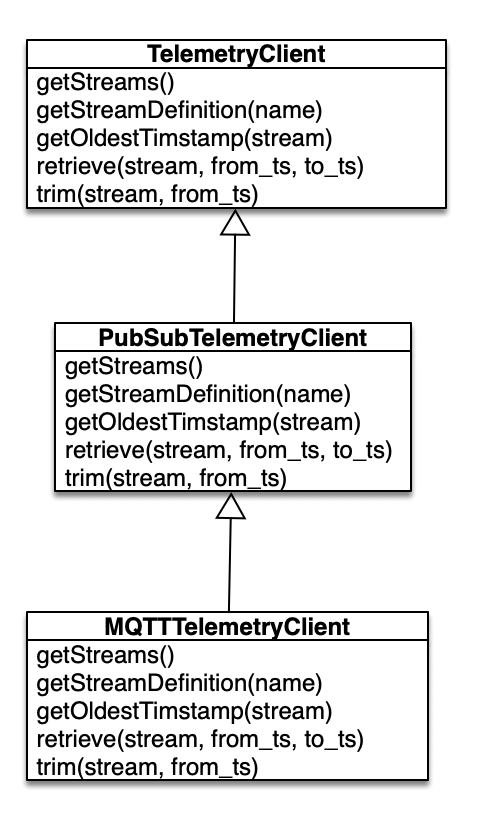
Methods are:
-
getStreams(callback)- retrieving all defined streams -
getStreamDefinition(stream_name, callback)- getting stream definition -
getOldestTimestamp(stream, callback)- finding out what the oldest timestamp in the set of logs -
trim(stream, to_timestamp)- removing all logs older than given timestamp -
retrieve(stream, from_timestamp, to_timestmap, callback)- retrieving all records from given timestamp older thanto_timestamp
As you can see all methods have a callback method that is going to be invoked when data from the server are ready. An example is in download-stream - a utility that downloads particular stream from the server into a file. You can choose byte representation or CSV (human readable) representation.
Conclusion
Python is OO programming language (Object Oriented) it was quite easy to make a simple logging system. Also, `struct' built package allowed bandwidth reduction of logged data (in comparison to ASCII representation) as all numbers can be packed as bytes, words, integers, longs, floats and doubles (as unsigned as well) allowing a smaller memory footprint. After all - it was quite a fun playing with code for this small library.
Currently the main implementation is over MQTT (which PyROS heavily relies on) and UNIX Pipes. It is now quite easy to extend it for logging to happen over IP sockets (for logging over different machines); replacing MQTT with some custom implementation that can go over same sockets; add REST implementation for low bandwidth communication and such...
 Still frame from the anime
  Still frame from the TV series